Ingest real-time financial data
Set up a data pipeline to get data from different financial APIs
The financial industry is extremely data-heavy and relies on real-time and historical data for decision-making, risk assessment, fraud detection, and market analysis. Tiger Data simplifies management of these large volumes of data, while also providing you with meaningful analytical insights and optimizing storage costs.
This tutorial shows you how to ingest real-time time-series data into TimescaleDB using a websocket connection. The tutorial sets up a data pipeline to ingest real-time data from our data partner, Twelve Data. Twelve Data provides a number of different financial APIs, including stock, cryptocurrencies, foreign exchanges, and ETFs. It also supports websocket connections in case you want to update your database frequently. With websockets, you need to connect to the server, subscribe to symbols, and you can start receiving data in real-time during market hours.
When you complete this tutorial, you’ll have a data pipeline set up that ingests real-time financial data into your Tiger Cloud.
This tutorial uses Python and the API wrapper library provided by Twelve Data.
This tutorial covers:
- Set up your dataset: connect to the Twelve Data websocket server, create hypertables, and ingest real-time cryptocurrency data.
- Query your data: create continuous aggregates to aggregate OHLCV data, query the aggregated data, and visualize the data in Grafana.
Prerequisites for this tutorial
To follow the procedure on this page you need to:
-
Create a target Tiger Cloud service.
This procedure also works for self-hosted TimescaleDB.
- Install and run self-managed Grafana, or sign up for Grafana Cloud.
- Install Python 3
- Sign up for Twelve Data. The free tier is perfect for this tutorial.
- Made a note of your Twelve Data API key.
About OHLCV data and candlestick charts
Section titled “About OHLCV data and candlestick charts”The financial sector regularly uses candlestick charts to visualize the price change of an asset. Each candlestick represents a time period, such as one minute or one hour, and shows how the asset’s price changed during that time.
Candlestick charts are generated from the open, high, low, close, and volume data for each financial asset during the time period. This is often abbreviated as OHLCV:
- Open: opening price
- High: highest price
- Low: lowest price
- Close: closing price
- Volume: volume of transactions
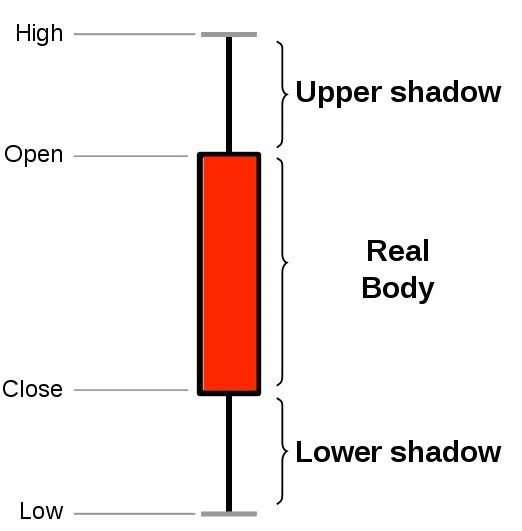
TimescaleDB is well suited to storing and analyzing financial candlestick data, and many Tiger Data community members use it for exactly this purpose.
Ingest data into a Tiger Cloud service
Section titled “Ingest data into a Tiger Cloud service”This tutorial uses a dataset that contains second-by-second cryptocurrency trade data,
in a hypertable named crypto_ticks. It also includes a separate table of
cryptocurrency symbols and names, in a regular PostgreSQL table named crypto_assets.
Connect to the websocket server
Section titled “Connect to the websocket server”When you connect to the Twelve Data API through a websocket, you create a persistent connection between your computer and the websocket server. You set up a Python environment, and pass two arguments to create a websocket object and establish the connection.
Set up a new Python environment
Section titled “Set up a new Python environment”Create a new Python virtual environment for this project and activate it. All the packages you need to complete for this tutorial are installed in this environment.
- Create and activate a Python virtual environment
Terminal window virtualenv envsource env/bin/activate - Install the Twelve Data Python wrapper library with websocket support
This library allows you to make requests to the API and maintain a stable websocket connection.
Terminal window pip install twelvedata websocket-client - Install Psycopg2
Psycopg2 enables you to connect to TimescaleDB from your Python script:
Terminal window pip install psycopg2-binary
Create the websocket connection
Section titled “Create the websocket connection”A persistent connection between your computer and the websocket server is used to receive data for as long as the connection is maintained. You need to pass two arguments to create a websocket object and establish connection.
Websocket arguments
-
on_eventThis argument needs to be a function that is invoked whenever there’s a new data record is received from the websocket:
def on_event(event):print(event) # prints out the data record (dictionary)This is where you want to implement the ingestion logic so whenever there’s new data available you insert it into the database.
-
symbolsThis argument needs to be a list of stock ticker symbols (for example,
MSFT) or crypto trading pairs (for example,BTC/USD). When using a websocket connection you always need to subscribe to the events you want to receive. You can do this by using thesymbolsargument or if your connection is already created you can also use thesubscribe()function to get data for additional symbols.
Connect to the websocket server
- Create a new Python file called
websocket_test.pyConnect to the Twelve Data servers using the
<YOUR_API_KEY>:import timefrom twelvedata import TDClientmessages_history = []def on_event(event):print(event) # prints out the data record (dictionary)messages_history.append(event)td = TDClient(apikey="<YOUR_API_KEY>")ws = td.websocket(symbols=["BTC/USD", "ETH/USD"], on_event=on_event)ws.subscribe(['ETH/BTC', 'AAPL'])ws.connect()while True:print('messages received: ', len(messages_history))ws.heartbeat()time.sleep(10) - Run the Python script
Terminal window python websocket_test.py - Verify the connection
When you run the script, you receive a response from the server about the status of your connection:
Terminal window {'event': 'subscribe-status','status': 'ok','success': [{'symbol': 'BTC/USD', 'exchange': 'Coinbase Pro', 'mic_code': 'Coinbase Pro', 'country': '', 'type': 'Digital Currency'},{'symbol': 'ETH/USD', 'exchange': 'Huobi', 'mic_code': 'Huobi', 'country': '', 'type': 'Digital Currency'}],'fails': None}When you have established a connection to the websocket server, wait a few seconds, and you can see data records, like this:
Terminal window {'event': 'price', 'symbol': 'BTC/USD', 'currency_base': 'Bitcoin', 'currency_quote': 'US Dollar', 'exchange': 'Coinbase Pro', 'type': 'Digital Currency', 'timestamp': 1652438893, 'price': 30361.2, 'bid': 30361.2, 'ask': 30361.2, 'day_volume': 49153}{'event': 'price', 'symbol': 'BTC/USD', 'currency_base': 'Bitcoin', 'currency_quote': 'US Dollar', 'exchange': 'Coinbase Pro', 'type': 'Digital Currency', 'timestamp': 1652438896, 'price': 30380.6, 'bid': 30380.6, 'ask': 30380.6, 'day_volume': 49157}{'event': 'heartbeat', 'status': 'ok'}{'event': 'price', 'symbol': 'ETH/USD', 'currency_base': 'Ethereum', 'currency_quote': 'US Dollar', 'exchange': 'Huobi', 'type': 'Digital Currency', 'timestamp': 1652438899, 'price': 2089.07, 'bid': 2089.02, 'ask': 2089.03, 'day_volume': 193818}{'event': 'price', 'symbol': 'BTC/USD', 'currency_base': 'Bitcoin', 'currency_quote': 'US Dollar', 'exchange': 'Coinbase Pro', 'type': 'Digital Currency', 'timestamp': 1652438900, 'price': 30346.0, 'bid': 30346.0, 'ask': 30346.0, 'day_volume': 49167}Each price event gives you multiple data points about the given trading pair such as the name of the exchange, and the current price. You can also occasionally see
heartbeatevents in the response; these events signal the health of the connection over time. At this point the websocket connection is working successfully to pass data.
Optimize time-series data in a hypertable
Hypertables are PostgreSQL tables in TimescaleDB that automatically partition your time-series data by time. Time-series data represents the way a system, process, or behavior changes over time. Hypertables enable TimescaleDB to work efficiently with time-series data. Each hypertable is made up of child tables called chunks. Each chunk is assigned a range of time, and only contains data from that range. When you run a query, TimescaleDB identifies the correct chunk and runs the query on it, instead of going through the entire table.
Hypercore is the hybrid row-columnar storage engine in TimescaleDB used by hypertables. Traditional databases force a trade-off between fast inserts (row-based storage) and efficient analytics (columnar storage). Hypercore eliminates this trade-off, allowing real-time analytics without sacrificing transactional capabilities.
Hypercore dynamically stores data in the most efficient format for its lifecycle:

- Row-based storage for recent data: the most recent chunk (and possibly more) is always stored in the rowstore, ensuring fast inserts, updates, and low-latency single record queries. Additionally, row-based storage is used as a writethrough for inserts and updates to columnar storage.
- Columnar storage for analytical performance: chunks are automatically compressed into the columnstore, optimizing storage efficiency and accelerating analytical queries.
Unlike traditional columnar databases, hypercore allows data to be inserted or modified at any stage, making it a flexible solution for both high-ingest transactional workloads and real-time analytics, within a single database.
Because TimescaleDB is 100% PostgreSQL, you can use all the standard PostgreSQL tables, indexes, stored procedures, and other objects alongside your hypertables. This makes creating and working with hypertables similar to standard PostgreSQL.
- Connect to your Tiger Cloud service
In Tiger Console open an SQL editor. You can also connect to your service using psql.
- Create a hypertable to store the real-time cryptocurrency data
Create a hypertable for your time-series data using CREATE TABLE. For efficient queries on data in the columnstore, remember to
segmentbythe column you will use most often to filter your data:CREATE TABLE crypto_ticks ("time" TIMESTAMPTZ,symbol TEXT,price DOUBLE PRECISION,day_volume NUMERIC) WITH (tsdb.hypertable,tsdb.segmentby='symbol',tsdb.orderby='time DESC');When you create a hypertable using CREATE TABLE … WITH …, the default partitioning column is automatically the first column with a timestamp data type. Also, TimescaleDB creates a columnstore policy that automatically converts your data to the columnstore, after an interval equal to the value of the chunk_interval, defined through
afterin the policy. This columnar format enables fast scanning and aggregation, optimizing performance for analytical workloads while also saving significant storage space. In the columnstore conversion, hypertable chunks are compressed by up to 98%, and organized for efficient, large-scale queries.You can customize this policy later using alter_job. However, to change
afterorcreated_before, the compression settings, or the hypertable the policy is acting on, you must remove the columnstore policy and add a new one.You can also manually convert chunks in a hypertable to the columnstore.
Create a standard PostgreSQL table for relational data
When you have relational data that enhances your time-series data, store that data in standard PostgreSQL relational tables.
- Add a table to store the asset symbol and name in a relational tableCREATE TABLE crypto_assets (symbol TEXT UNIQUE,"name" TEXT);
You now have two tables within your Tiger Cloud service. A hypertable named crypto_ticks, and a normal
PostgreSQL table named crypto_assets.
When you ingest data into a transactional database like TimescaleDB, it is more efficient to insert data in batches rather than inserting data row-by-row. Using one transaction to insert multiple rows can significantly increase the overall ingest capacity and speed of your Tiger Cloud service.
Batching in memory
Section titled “Batching in memory”A common practice to implement batching is to store new records in memory first, then after the batch reaches a certain size, insert all the records from memory into the database in one transaction. The perfect batch size isn’t universal, but you can experiment with different batch sizes (for example, 100, 1000, 10000, and so on) and see which one fits your use case better. Using batching is a fairly common pattern when ingesting data into TimescaleDB from Kafka, Kinesis, or websocket connections.
To ingest the data into your Tiger Cloud service, you need to implement the
on_event function.
After the websocket connection is set up, you can use the on_event function
to ingest data into the database. This is a data pipeline that ingests real-time
financial data into your Tiger Cloud service.
You can implement a batching solution in Python with Psycopg2.
You can implement the ingestion logic within the on_event function that
you can then pass over to the websocket object.
This function needs to:
- Check if the item is a data item, and not websocket metadata.
- Adjust the data so that it fits the database schema, including the data types, and order of columns.
- Add it to the in-memory batch, which is a list in Python.
- If the batch reaches a certain size, insert the data, and reset or empty the list.
Ingest data in real-time
Section titled “Ingest data in real-time”- Update the Python script
Update the script to print out the current batch size, so you can follow when data gets ingested from memory into your database. Use the
<HOST>,<PASSWORD>, and<PORT>details for the Tiger Cloud service where you want to ingest the data and your API key from Twelve Data:import timeimport psycopg2from twelvedata import TDClientfrom psycopg2.extras import execute_valuesfrom datetime import datetimeclass WebsocketPipeline():# name of the hypertableDB_TABLE = "crypto_ticks"# columns in the hypertable in the correct orderDB_COLUMNS=["time", "symbol", "price", "day_volume"]# batch size used to insert data in batchesMAX_BATCH_SIZE=100def __init__(self, conn):"""Connect to the Twelve Data web socket server and streamdata into the database.Args:conn: psycopg2 connection object"""self.conn = connself.current_batch = []self.insert_counter = 0def _insert_values(self, data):if self.conn is not None:cursor = self.conn.cursor()sql = f"""INSERT INTO {self.DB_TABLE} ({','.join(self.DB_COLUMNS)})VALUES %s;"""execute_values(cursor, sql, data)self.conn.commit()def _on_event(self, event):"""This function gets called whenever there's a new data record comingback from the server.Args:event (dict): data record"""if event["event"] == "price":# data recordtimestamp = datetime.utcfromtimestamp(event["timestamp"])data = (timestamp, event["symbol"], event["price"], event.get("day_volume"))# add new data record to batchself.current_batch.append(data)print(f"Current batch size: {len(self.current_batch)}")# ingest data if max batch size is reached then reset the batchif len(self.current_batch) == self.MAX_BATCH_SIZE:self._insert_values(self.current_batch)self.insert_counter += 1print(f"Batch insert #{self.insert_counter}")self.current_batch = []def start(self, symbols):"""Connect to the web socket server and start streaming real-time datainto the database.Args:symbols (list of symbols): List of stock/crypto symbols"""td = TDClient(apikey="<YOUR_API_KEY>")ws = td.websocket(on_event=self._on_event)ws.subscribe(symbols)ws.connect()while True:ws.heartbeat()time.sleep(10)conn = psycopg2.connect(database="tsdb",host="<HOST>",user="tsdbadmin",password="<PASSWORD>",port="<PORT>")symbols = ["BTC/USD", "ETH/USD", "MSFT", "AAPL"]websocket = WebsocketPipeline(conn)websocket.start(symbols=symbols) - Run the script
Terminal window python websocket_test.py
You can even create separate Python scripts to start multiple websocket connections for different types of symbols, for example, one for stock, and another one for cryptocurrency prices.
Troubleshooting
Section titled “Troubleshooting”If you see an error message similar to this:
2022-05-13 18:51:41,976 - ws-twelvedata - ERROR - TDWebSocket ERROR: Handshake status 200 OKThen check that you use a proper API key received from Twelve Data.
Query the data
Section titled “Query the data”To look at OHLCV values, the most effective way is to create a continuous aggregate. You can create a continuous aggregate to aggregate data for each day, then set the aggregate to refresh every day, and aggregate the last two days’ worth of data.
Creating a continuous aggregate
Section titled “Creating a continuous aggregate”- Connect to the Tiger Cloud service
Connect to the service that contains the Twelve Data cryptocurrency dataset.
- Create the continuous aggregate to aggregate data every dayCREATE MATERIALIZED VIEW one_day_candleWITH (timescaledb.continuous) ASSELECTtime_bucket('1 day', time) AS bucket,symbol,FIRST(price, time) AS "open",MAX(price) AS high,MIN(price) AS low,LAST(price, time) AS "close",LAST(day_volume, time) AS day_volumeFROM crypto_ticksGROUP BY bucket, symbol;
When you create the continuous aggregate, it refreshes by default.
- Set a refresh policy to update the continuous aggregate every day
This refreshes if there is new data available in the hypertable for the last two days:
SELECT add_continuous_aggregate_policy('one_day_candle',start_offset => INTERVAL '3 days',end_offset => INTERVAL '1 day',schedule_interval => INTERVAL '1 day');
Query the continuous aggregate
Section titled “Query the continuous aggregate”When you have your continuous aggregate set up, you can query it to get the OHLCV values.
- Connect to the Tiger Cloud service
Connect to the service that contains the Twelve Data cryptocurrency dataset.
- Select all Bitcoin OHLCV data for the past 14 days
At the psql prompt, use this query to select by time bucket:
SELECT * FROM one_day_candleWHERE symbol = 'BTC/USD' AND bucket >= NOW() - INTERVAL '14 days'ORDER BY bucket;The result of the query looks like this:
bucket | symbol | open | high | low | close | day_volume------------------------+---------+---------+---------+---------+---------+------------2022-11-24 00:00:00+00 | BTC/USD | 16587 | 16781.2 | 16463.4 | 16597.4 | 218032022-11-25 00:00:00+00 | BTC/USD | 16597.4 | 16610.1 | 16344.4 | 16503.1 | 207882022-11-26 00:00:00+00 | BTC/USD | 16507.9 | 16685.5 | 16384.5 | 16450.6 | 12300
Connect Grafana to Tiger Cloud
To visualize the results of your queries, enable Grafana to read the data in your service:
- Log in to Grafana
In your browser, log in to either:
- Self-hosted Grafana: at
http://localhost:3000/. The default credentials areadmin,admin. - Grafana Cloud: use the URL and credentials you set when you created your account.
- Self-hosted Grafana: at
- Add your service as a data source
-
Open
Connections>Data sources, then clickAdd new data source. -
Select
PostgreSQLfrom the list. -
Configure the connection:
Host URL,Database name,Username, andPassword, configure using your connection details.Host URLis in the format<host>:<port>.TLS/SSL Mode: selectrequire.{C.PG} options: enableTimescaleDB.- Leave the default setting for all other fields.
-
Click
Save & test.Grafana checks that your details are set correctly.
-
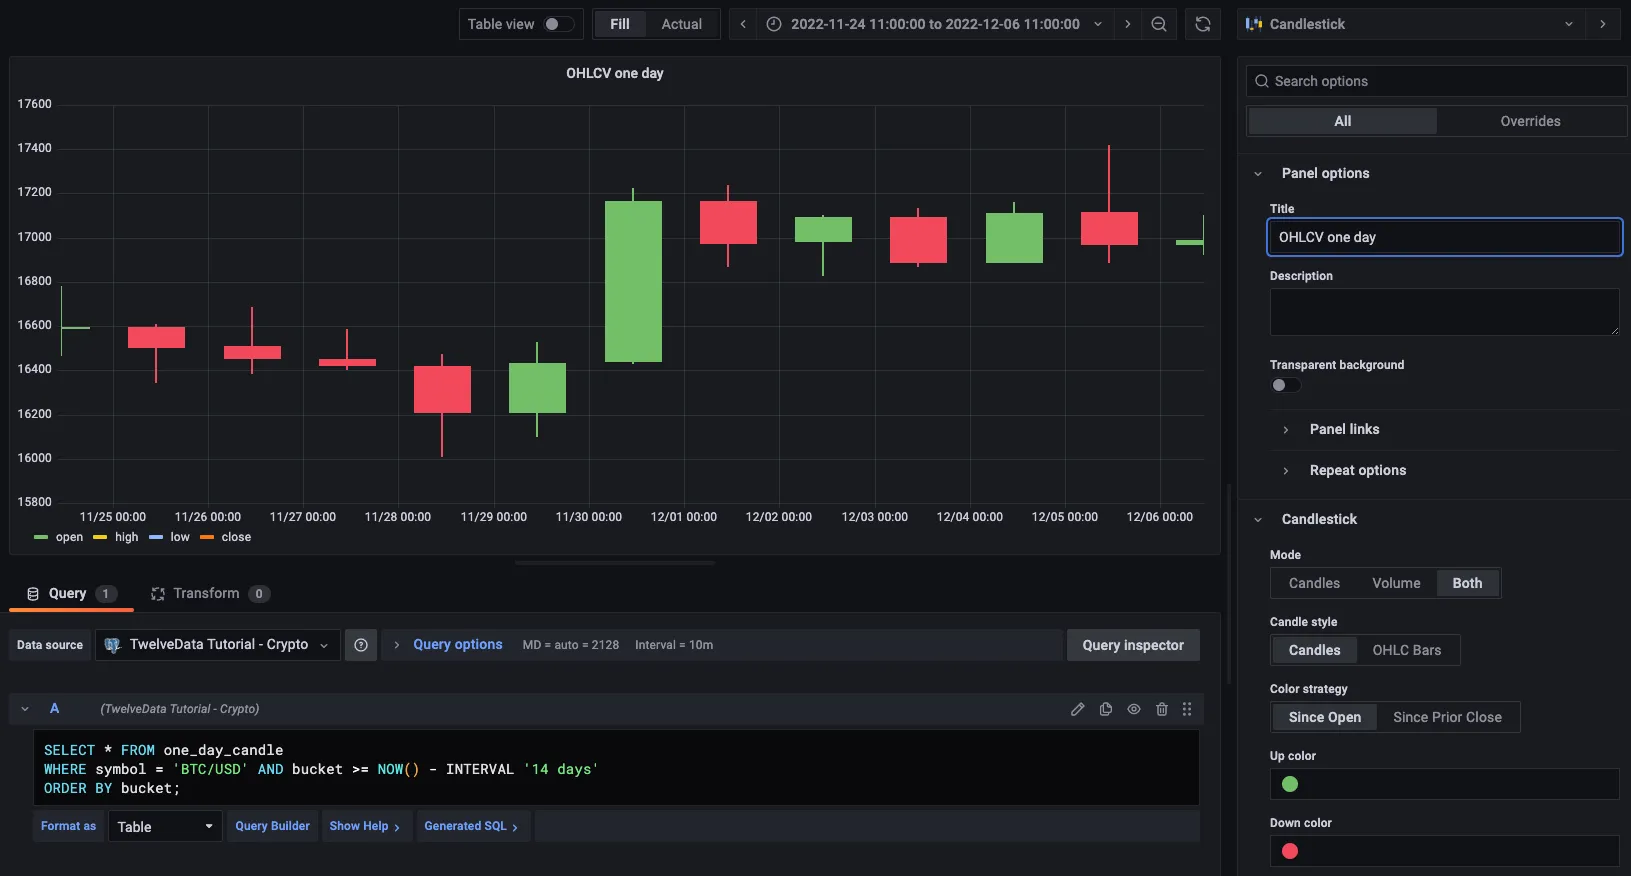
Graph OHLCV data
When you have extracted the raw OHLCV data, you can use it to graph the result in a candlestick chart, using Grafana.
- Create a new dashboard
In Grafana, from the
Dashboardspage, clickNewand selectNew dashboard. - Add a Candlestick visualization
Click
Add visualization, then select the data source that connects to your Tiger Cloud service and theCandlestickvisualization type in the top right. - Paste the OHLCV query
In the
Queriessection, selectCodeand paste the query you used to get the OHLCV values:SELECT * FROM one_day_candleWHERE symbol = 'BTC/USD' AND bucket >= NOW() - INTERVAL '14 days'ORDER BY bucket; - Apply and save your graph
Adjust elements of the table as required, and click
Applyto save your graph to the dashboard.