Logging
Retrieve logging information on Managed Service for TimescaleDB
There are a number of different ways to review logs and metrics for your Managed Service for TimescaleDB services. You can use the native logging tool in MST Console, retrieve detailed logs using the Aiven CLI tool, or integrate a third-party service, such as SolarWinds Loggly.
Native logging
Section titled “Native logging”To see the most recent logged events for your MST service:
- Find the service
In MST Console, in the
Servicestab, find the MST service you want to review, and check it is marked asRunning. - View the logs
Navigate to the
Logstab to see a constantly updated list of logged events.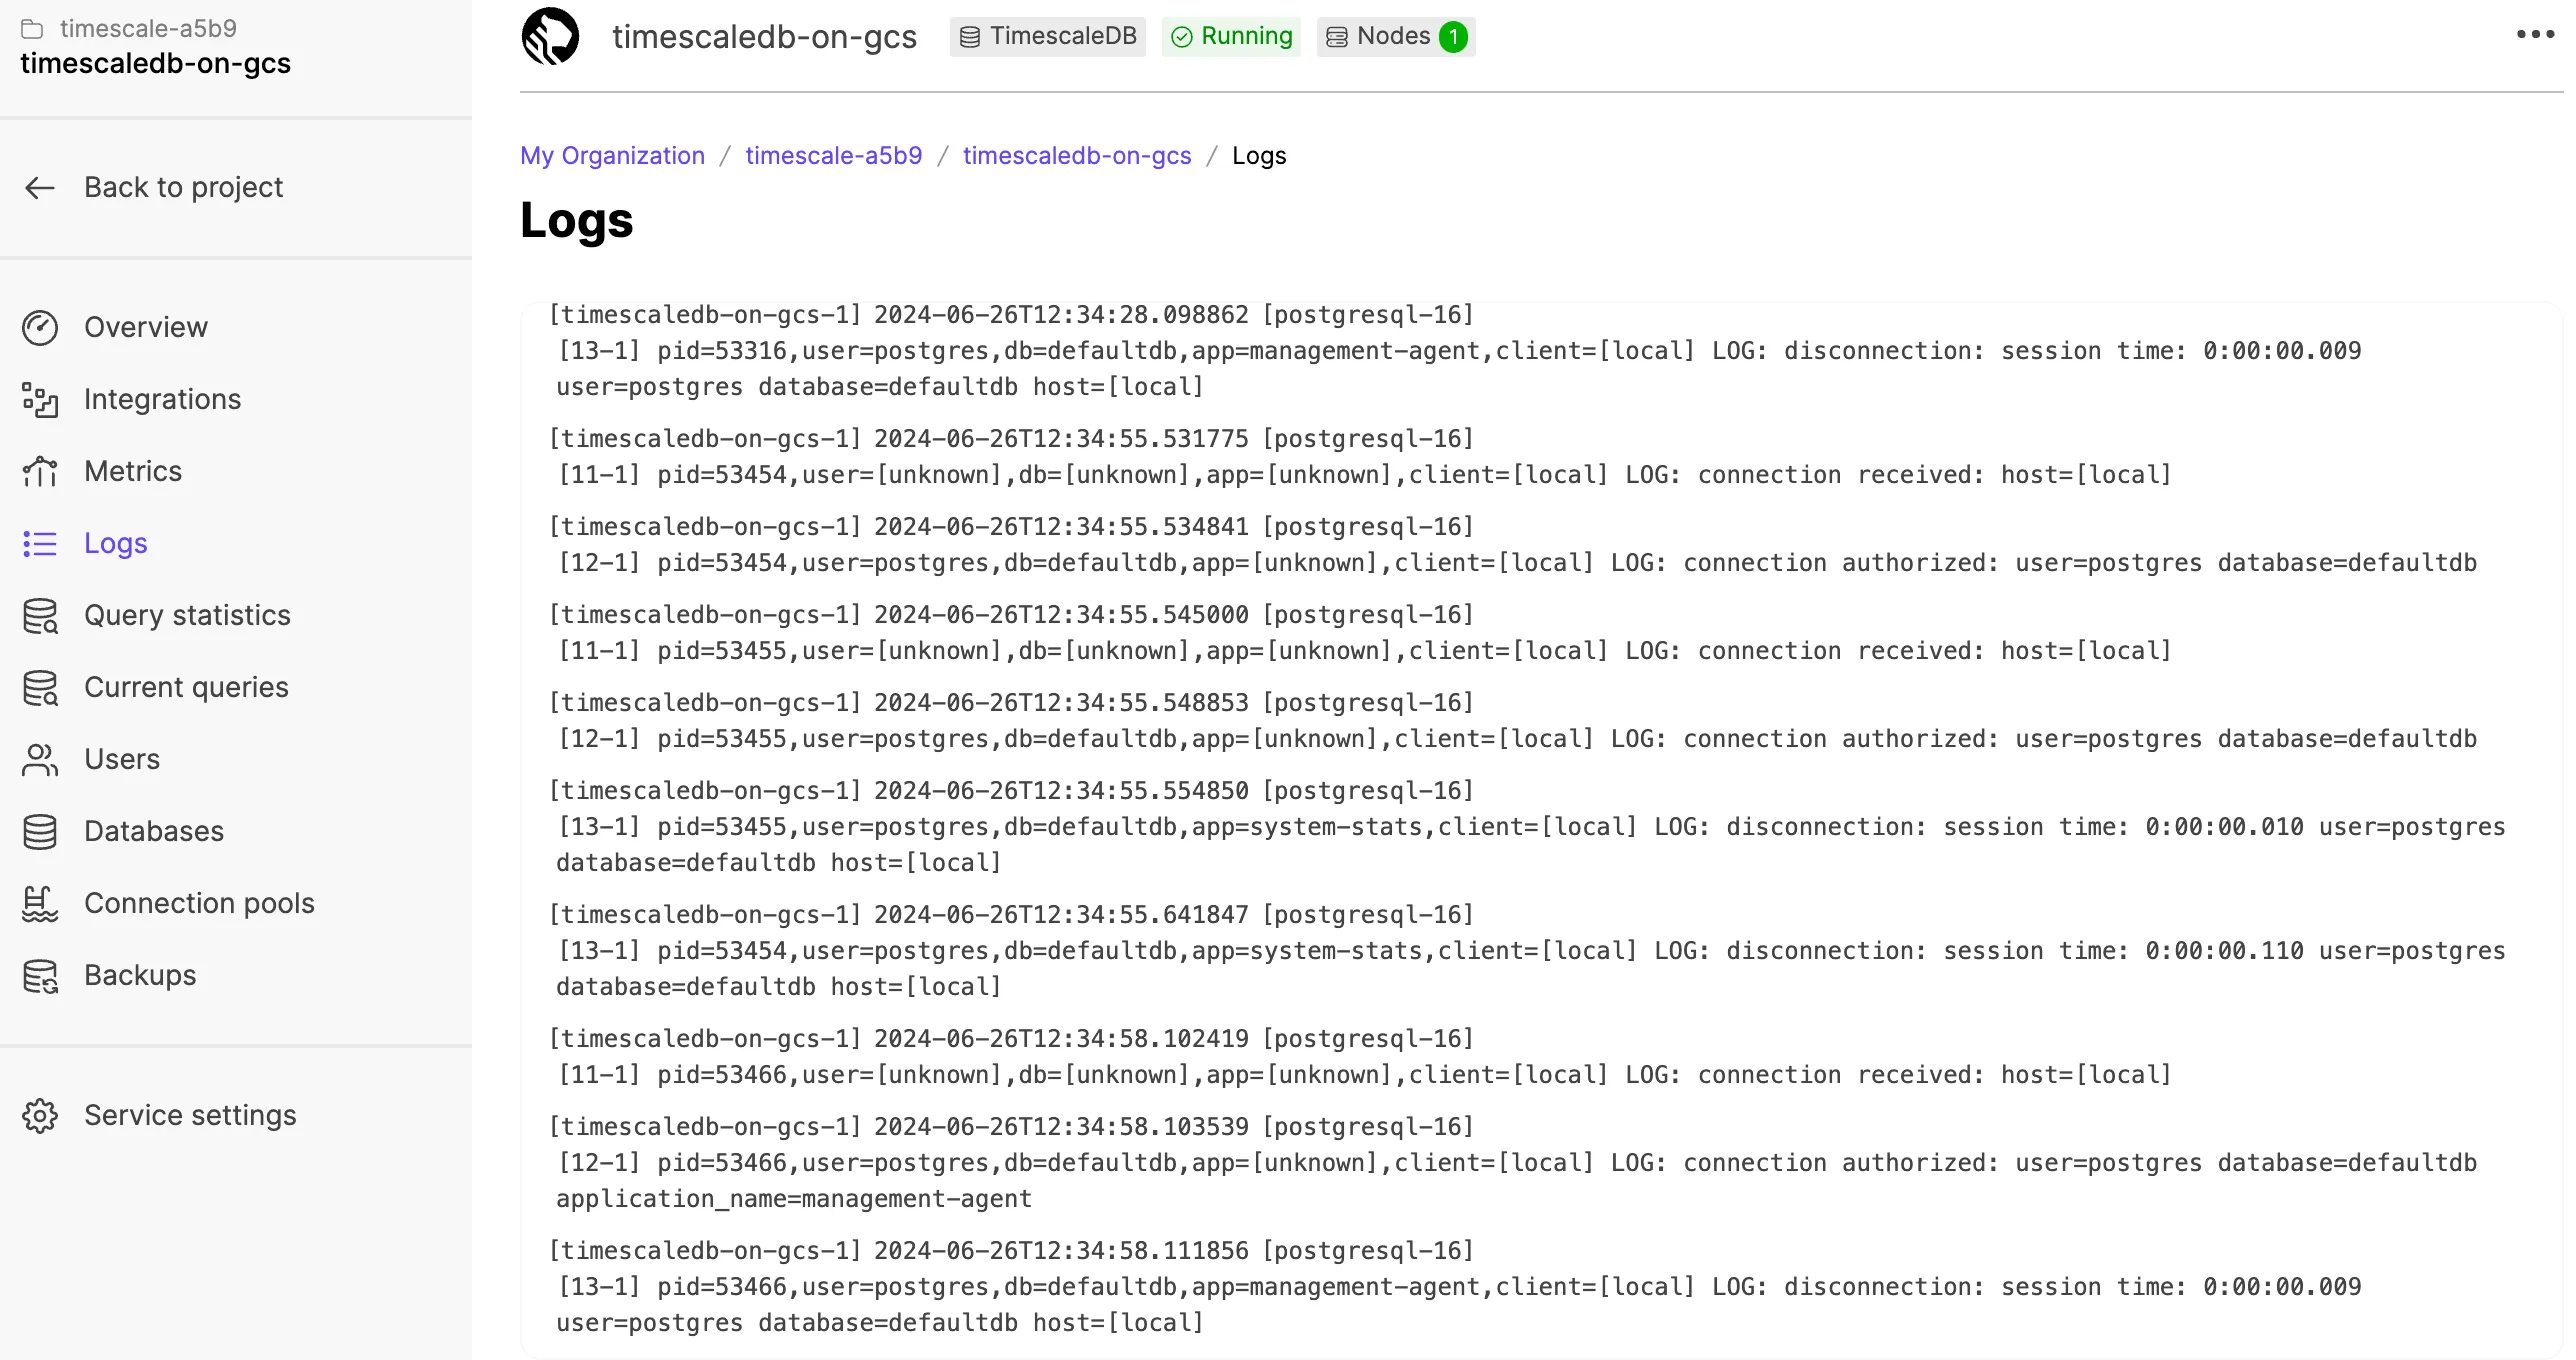
Dump logs to a text file with the Aiven CLI
Section titled “Dump logs to a text file with the Aiven CLI”If you want to dump your Managed Service for TimescaleDB logs to a text file or an archive for use later on, you can use the Aiven CLI.
Sign in to your Managed Service for TimescaleDB account from the Aiven CLI tool,
and use this command to dump your logs to a text file called tslogs.txt:
avn service logs -S desc -f --project <project name> <service_name> > tslogs.txtFor more information about the Aiven CLI tool, see the Aiven Client section.
Logging integrations
Section titled “Logging integrations”If you need to access logs for your MST services regularly, or if you need more detailed logging than Managed Service for TimescaleDB can provide in MST Console, you can connect your Managed Service for TimescaleDB to a logging service such as SolarWinds Loggly.
This section covers how to create a service integration to Loggly with Managed Service for TimescaleDB.
- Create or log in to Loggly
Navigate to SolarWinds Loggly and create or log in to your account.
- Create a customer token
From the Loggly Home screen, navigate to
Logs→Source Setup. ClickCustomer Tokensfrom the top menu bar.On the
Customer Tokenspage, clickAdd Newto create a new token. Give your token a name, and clickSave. Copy your new token to your clipboard. - Add a new Syslog endpoint
Log in to your Managed Service for TimescaleDB account, and navigate to
Service Integrations. Navigate toSyslog, and clickAdd new endpoint. - Configure the Syslog endpoint
In the
Create new syslog endpointdialog, complete these fields:- In the
Endpoint namefield, type a name for your endpoint. - In the
Serverfield, typelogs-01.loggly.com. - In the
Portfield, type514. - Uncheck the
TLScheckbox. - In the
Formatfield, selectrfc5425. - In the
Structured Datafield, type<LOGGLY_TOKEN>@41058, using the Loggly token you copied earlier. You can also add a tag here, which you can use to more easily search for your logs in Loggly. For example,8480330f5-aa09-46b0-b220-a0efa372b17b@41058 TAG="example-tag".
Click
Createto create the endpoint. When the endpoint has been created, it shows as an enabled service integration, with a greenactiveindicator. - In the
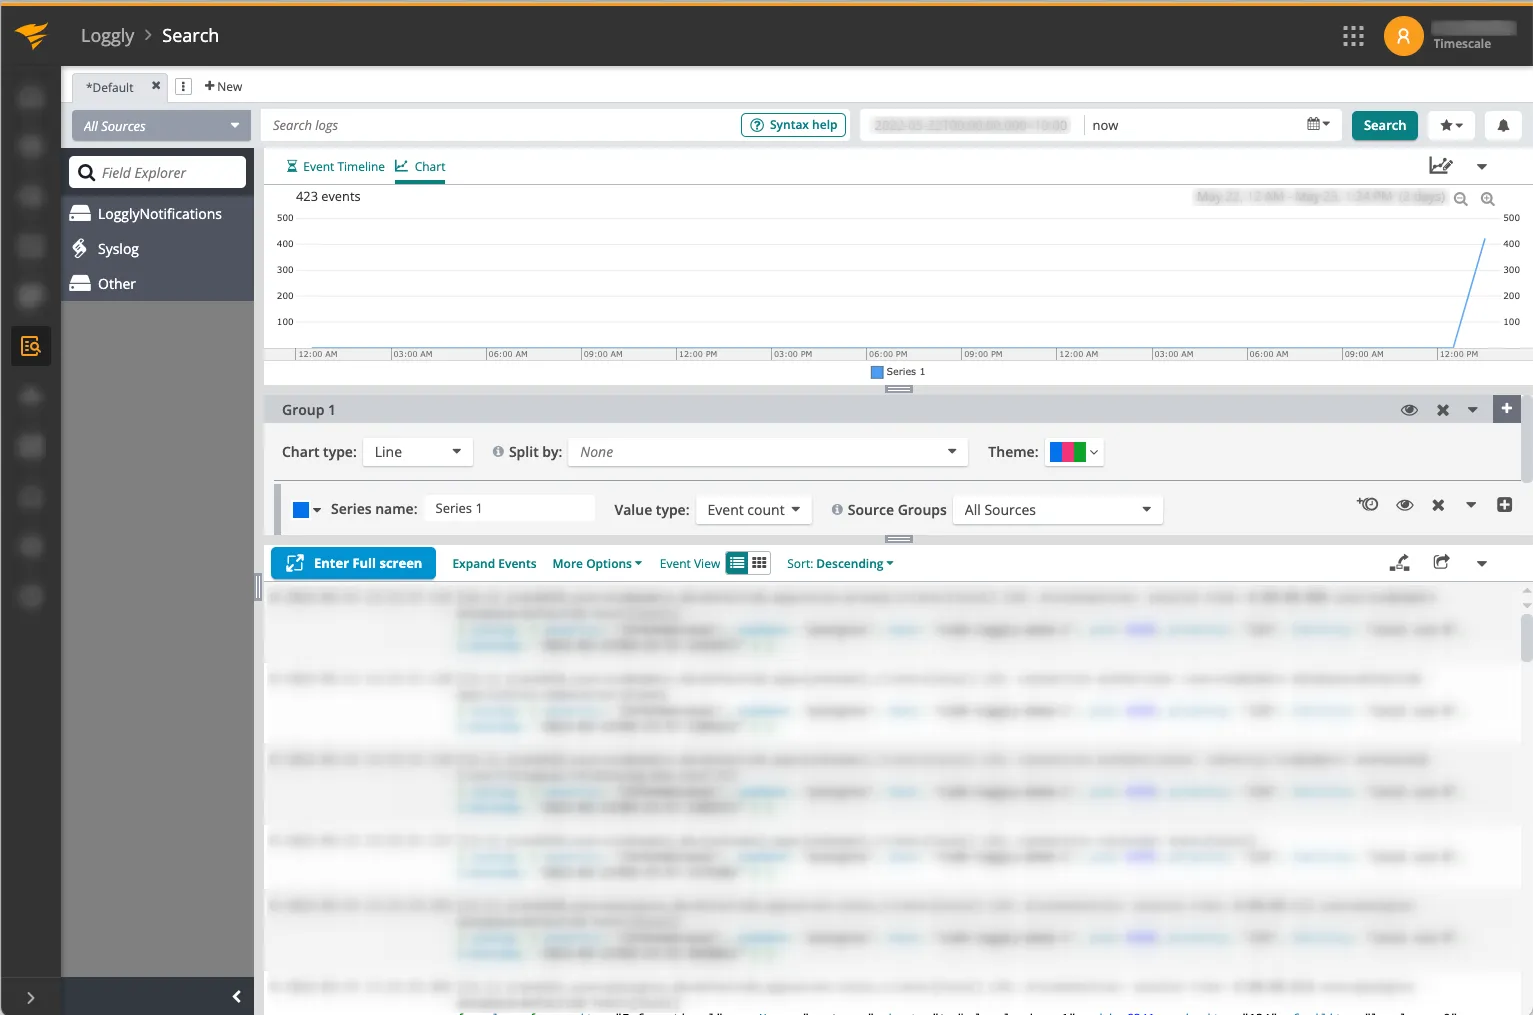
- View incoming logs in Loggly
In the Loggly dashboard, navigate to
Searchto see your incoming logs. From here, you can create custom dashboards and view reports for your logs.